Optical Clearing for Improved Confocal Imaging of Thick Specimens
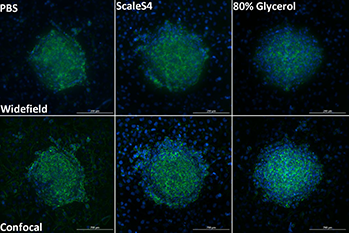
Developed almost 70 years ago, confocal microscopy has become a mainstay for imaging fluorescently labeled biological samples. Widefield microscopy illuminates biological samples with a diffuse field of light that excites fluorophores above and below the focal plane of interest, resulting in a blurry, less resolved image. By placing a pinhole in a conjugate focal plane between the sample and the light detector (camera or PMT), confocal microscopy blocks contaminating out-of-focus light, thus improving axial (z) resolution (Figure 1). This improved resolution means that finer z-sections can be taken deeper within thick samples, such as spheroids and resected tissue, and three-dimensional biological relationships can be better elucidated.
Poor image quality and resolution (e.g. signal-to-noise ratio) can result not only from excited out-of-focus fluorophores but also from biological matter such as lipids and proteins. In the latter case, in-focus light diffracts as it travels through the sample, reducing the amount of signal that is detected. This diffractive effect is quantified by the refractive index, which is a measure of how the speed of light is influenced as it passes through a material. Matching the refractive index of the mounting medium and the sample with the microscope optics as close as possible will aid in minimizing diffracted light, which in turn will improve the quality of the image.

Figure 1 See references section below.
Many clearing agents and mounting media have been developed to help reduce diffracted light by altering the refractive index of the sample so that they better match the refractive index of the microscope optics. Selecting the most appropriate clearing agent requires consideration of multiple factors, including sample thickness, imaging depth, fluorophore type, and vessel format and material.

Figure 2 See references section below.
Some clearing agents function by simply exchanging the primarily water-based intracellular environment with a liquid that has a better-matched refractive index, such as glycerol. Alternatively, some clearing agents improve sample clarity by extracting lipids (delipidation). Clearing agents that simply exchange the intracellular aqueous environment are minimally invasive than tend to favor smaller samples and those where fluorescent proteins are used. While clearing agents that delipidate may improve imaging depth to a greater degree, these agents typically employ harsh detergents and electrophoretic devices to draw lipids away from the sample.
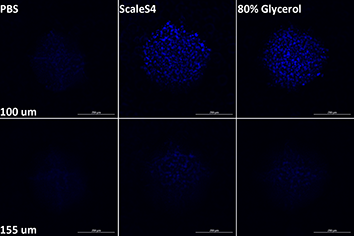
Some delipidating clearing agents use organic solvents, which may be incompatible with fluorescent protein-based samples. Additionally, organic solvent-based clearing agents may not be compatible with imaging vessels that use glass alternatives as the imaging window, such as cycloolefin. This technical note describes the use of a refractive index-correcting clearing agent (Figure 2) to improve imaging depth of thick samples such as HT-1080 spheroids.
Sample Preparation for Imaging HT1080 Spheroids
HT-1080 spheroids were formed by seeding 1,000 cells into ultra-low-attachment (ULA) U-bottom 96-well plates, #4520, from Corning and allowed to coalesce for 24 hours in Gibco Advanced DMEM from Thermo Fisher Scientific at 37°C. Spheroids were then transferred to clear, flat-bottom 96-well plates, #204626, from Agilent Technologies (1 spheroid per well) and allowed to settle and establish adhesion at RT for one hour. Plates containing spheroids were then transferred back to the 37°C incubator and allowed to attach to the culture area and spread overnight. Attached spheroids with migrating cell regions were fixed with 4% PFA for 30 minutes, then permeabilized with 0.5% for one hour. To achieve full penetration of dyes, spheroids were stained with Hoechst 34580 and Alexa Fluor 488-phalloidin overnight at 4°C. Spheroids were then washed, and PBS was either maintained or exchanged for either a homemade mounting medium (80% glycerol, 20 mM tris, pH 8.0, 0.5% n-propyl gallate, 0.05% NaN3) or the ScaleS4 (40% D-sorbitol, 10% glycerol, 4M urea, 15% DMSO, 0.5% n-propyl gallate, 0.05% NaN3) (Figure 1).
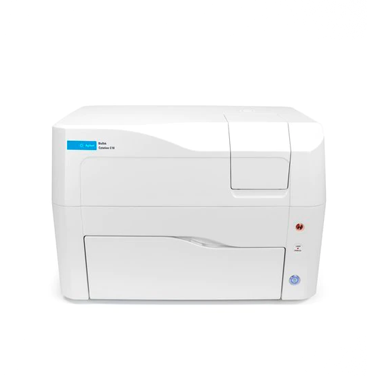
Confocal and widefield z-stack images of attached HT-1080 spheroids were captured at 40x using the Cytation C10 confocal imaging reader and Gen5 software in Manual Mode (IMM). The dynamic range of each channel was maximized by selecting the “show saturated pixels” button. The exposure settings for each channel were adjusted such that they were within range, and there were no saturated pixels. The z-range was determined by toggling below and above the sample until the structure of interest (in this example, a spheroid) faded in intensity.
The z-step size was set using Nyquist sampling recommendations; for imaging Alexa Fluor 488 using the 40x air objective (NA = 0.6), steps sizes were determined to be 1 µm for widefield and 0.6 µm for confocal. Images were then subjected to five iterations of deconvolution using a point spread function based on the objective. Deconvolved images were then pre-processed to reduce background signal. The rolling ball size for background reduction for Hoechst 34580 (DAPI channel) and Alexa Fluor 488-phalloidin was set to 25 and 50 µm, respectively. Equivalent z-heights for all three conditions (PBS, 80% glycerol, ScaleS4) were compared to determine imaging depth limits (Figure 2).
Confocal microscopy is a powerful mode of imaging that improves image quality by removing out-of-focus light. However, sources of diffracted fluorescent light inherent to the sample prevent this improvement from being truly realized. Use of clearing agents allows matching the refractive index of the sample, in this case HT-1080 spheroids, with the refractive index of the optical system allowing imaging depth and resolution to be improved.
References
- Figure 1. Adhered HT-1080 spheroids. Adhered 1000-cell HT-1080 spheroids were fixed and stained with Hoechst 33342 and Alexa Fluor 488-phalloidin, then buffer (PBS) was either maintained or exchanged for ScaleS4 clearing agent or 80% glycerol. Z-stacks were then captured at 20x (0.45NA) in either widefield or confocal (60 µm disc) mode. Maximum intensity projections of the entire z-stack were then generated.
- Figure 2. Imaging depth limits of adhered HT-1080 spheroids in different imaging media. Z-slices from each adhered spheroid in Figure 1 were selected when nuclei become unresolvable for PBS (upper panels), or for ScaleS4 or 80% glycerol (lower panels)


